Understanding Your Invitation Analytics
See how many people viewed your invitation, where they came from, what devices they used, and how your RSVPs are trending.
Opening Analytics
Click Analytics in the invitation sidebar. The dashboard shows data from the last 30 days.
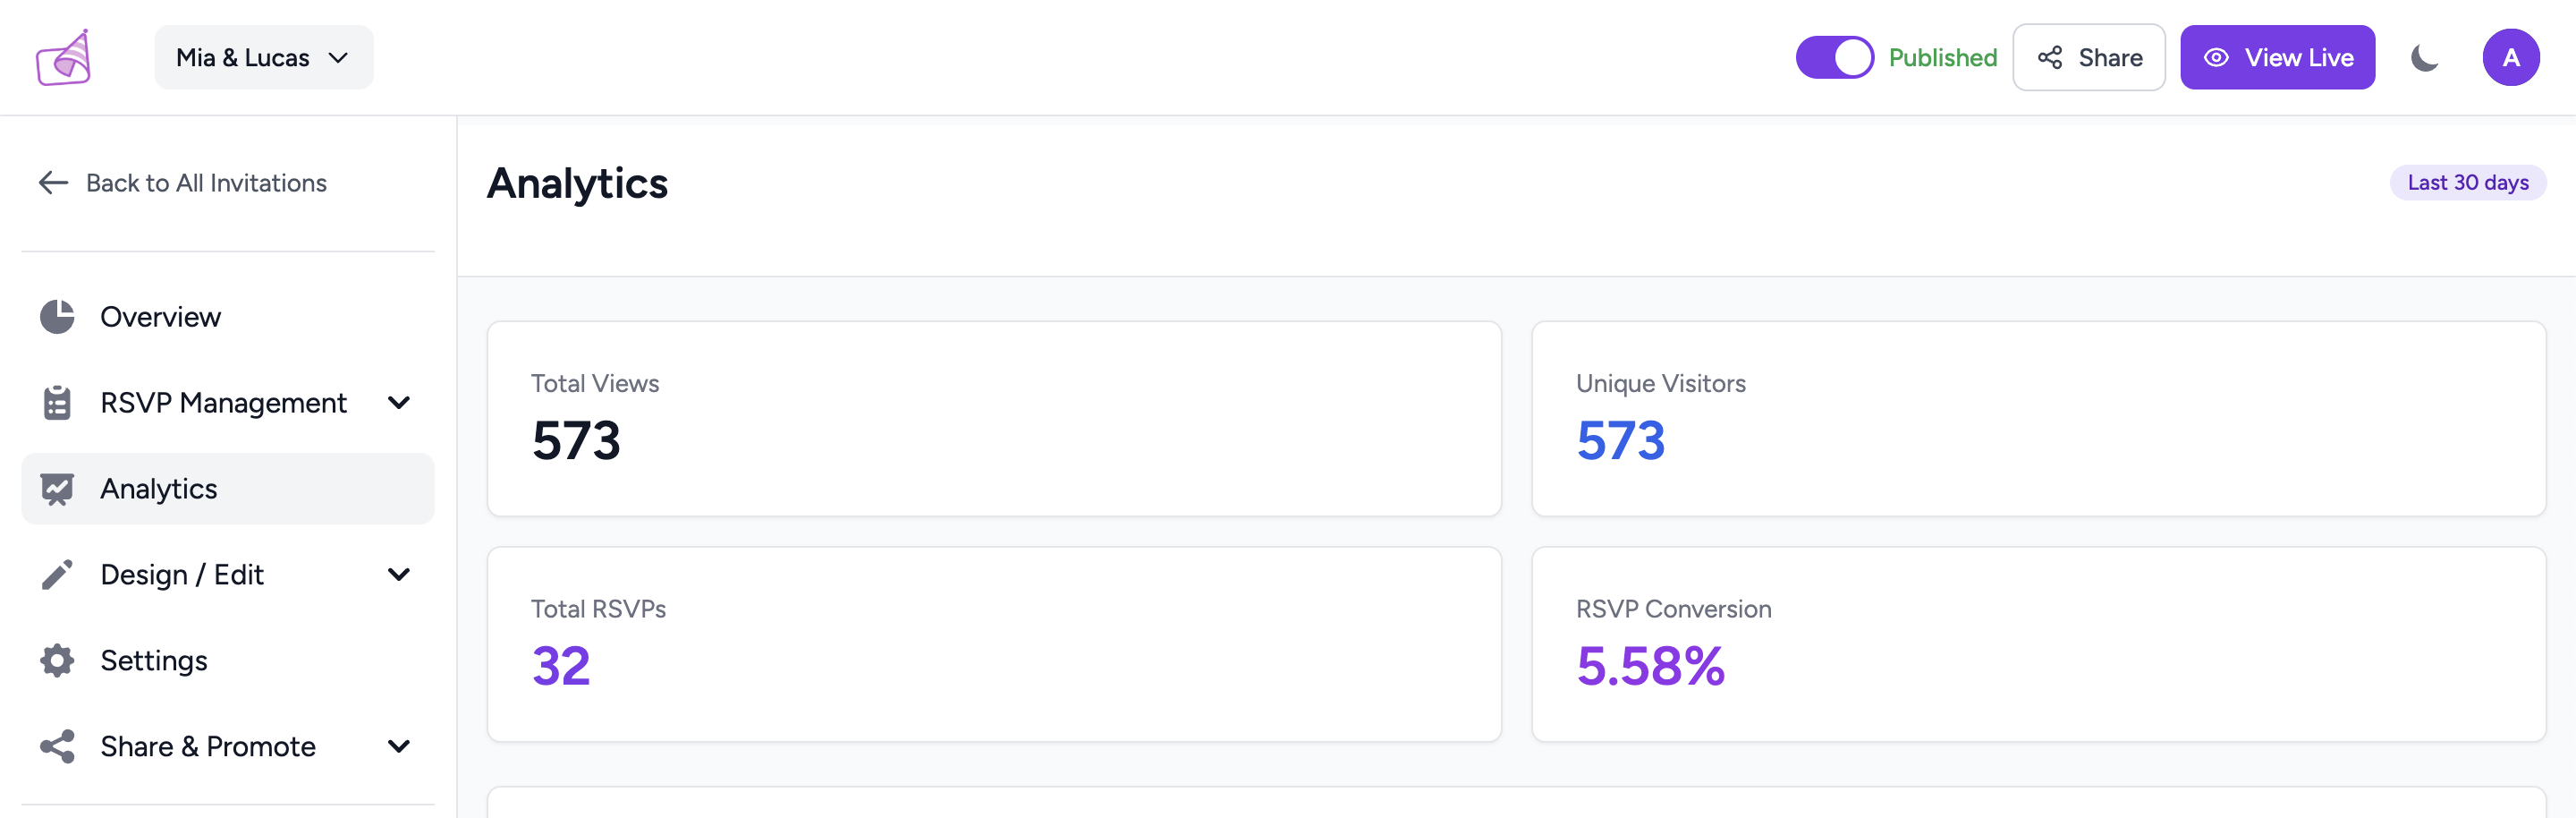
Free stats (always visible)
Total Views
Every time someone opens your invitation link — including the same person visiting multiple times.Total RSVPs
The total number of RSVP form submissions received.Premium stats
The following metrics require a Premium subscription. Upgrade from the Billing page or click Upgrade to Premium on any locked stat.
Unique Visitors
Distinct people who opened your invitation (de-duplicated). More meaningful than raw views.RSVP Conversion Rate
The percentage of unique visitors who also submitted an RSVP.Premium charts explained
Views & RSVP Trend (Last 30 Days)
Line chart showing daily views and a bar chart showing daily RSVP submissions. Useful for spotting when your sharing bursts happened (e.g., the day you sent the WhatsApp message).
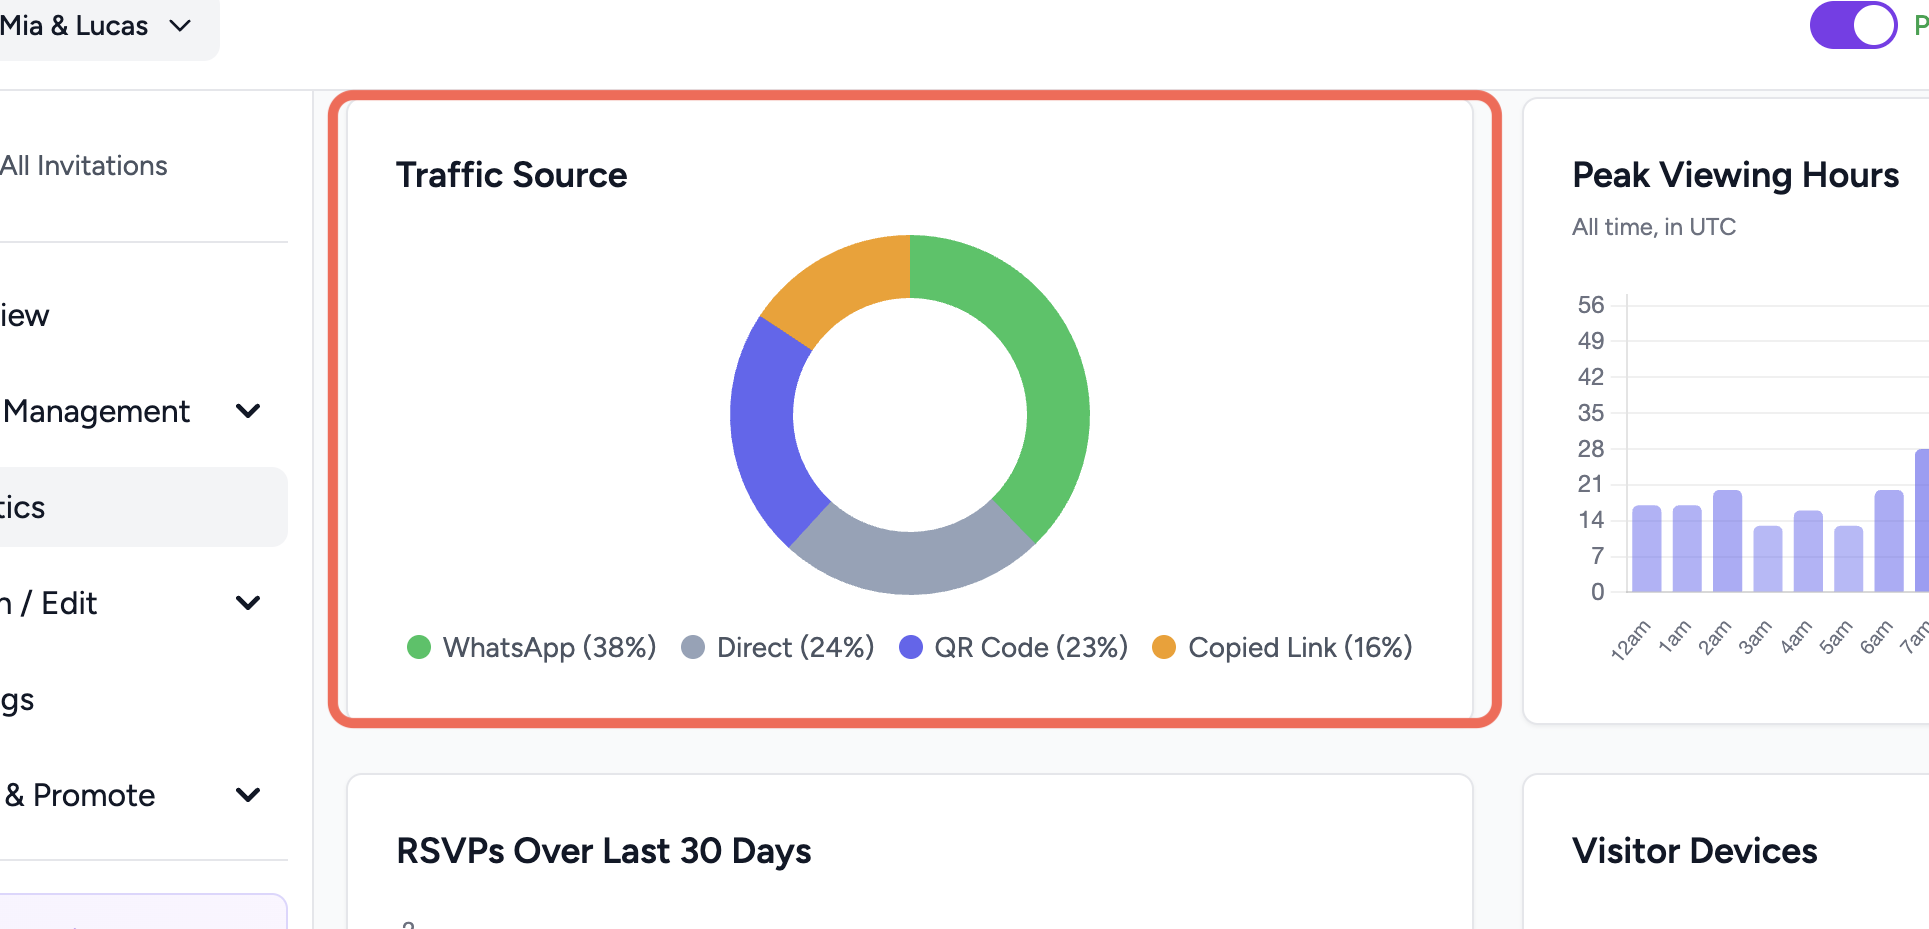
Traffic Sources
A doughnut chart breaking down how guests found your invitation:
- WhatsApp — opened via a WhatsApp link
- QR Code — scanned a QR code (e.g., printed on a card)
- Copied Link — pasted from a clipboard (email, SMS, etc.)
- Direct — typed in the URL directly
Peak Viewing Hours
A 24-hour bar chart showing which hours of the day get the most views. Helps you know when guests are most active.
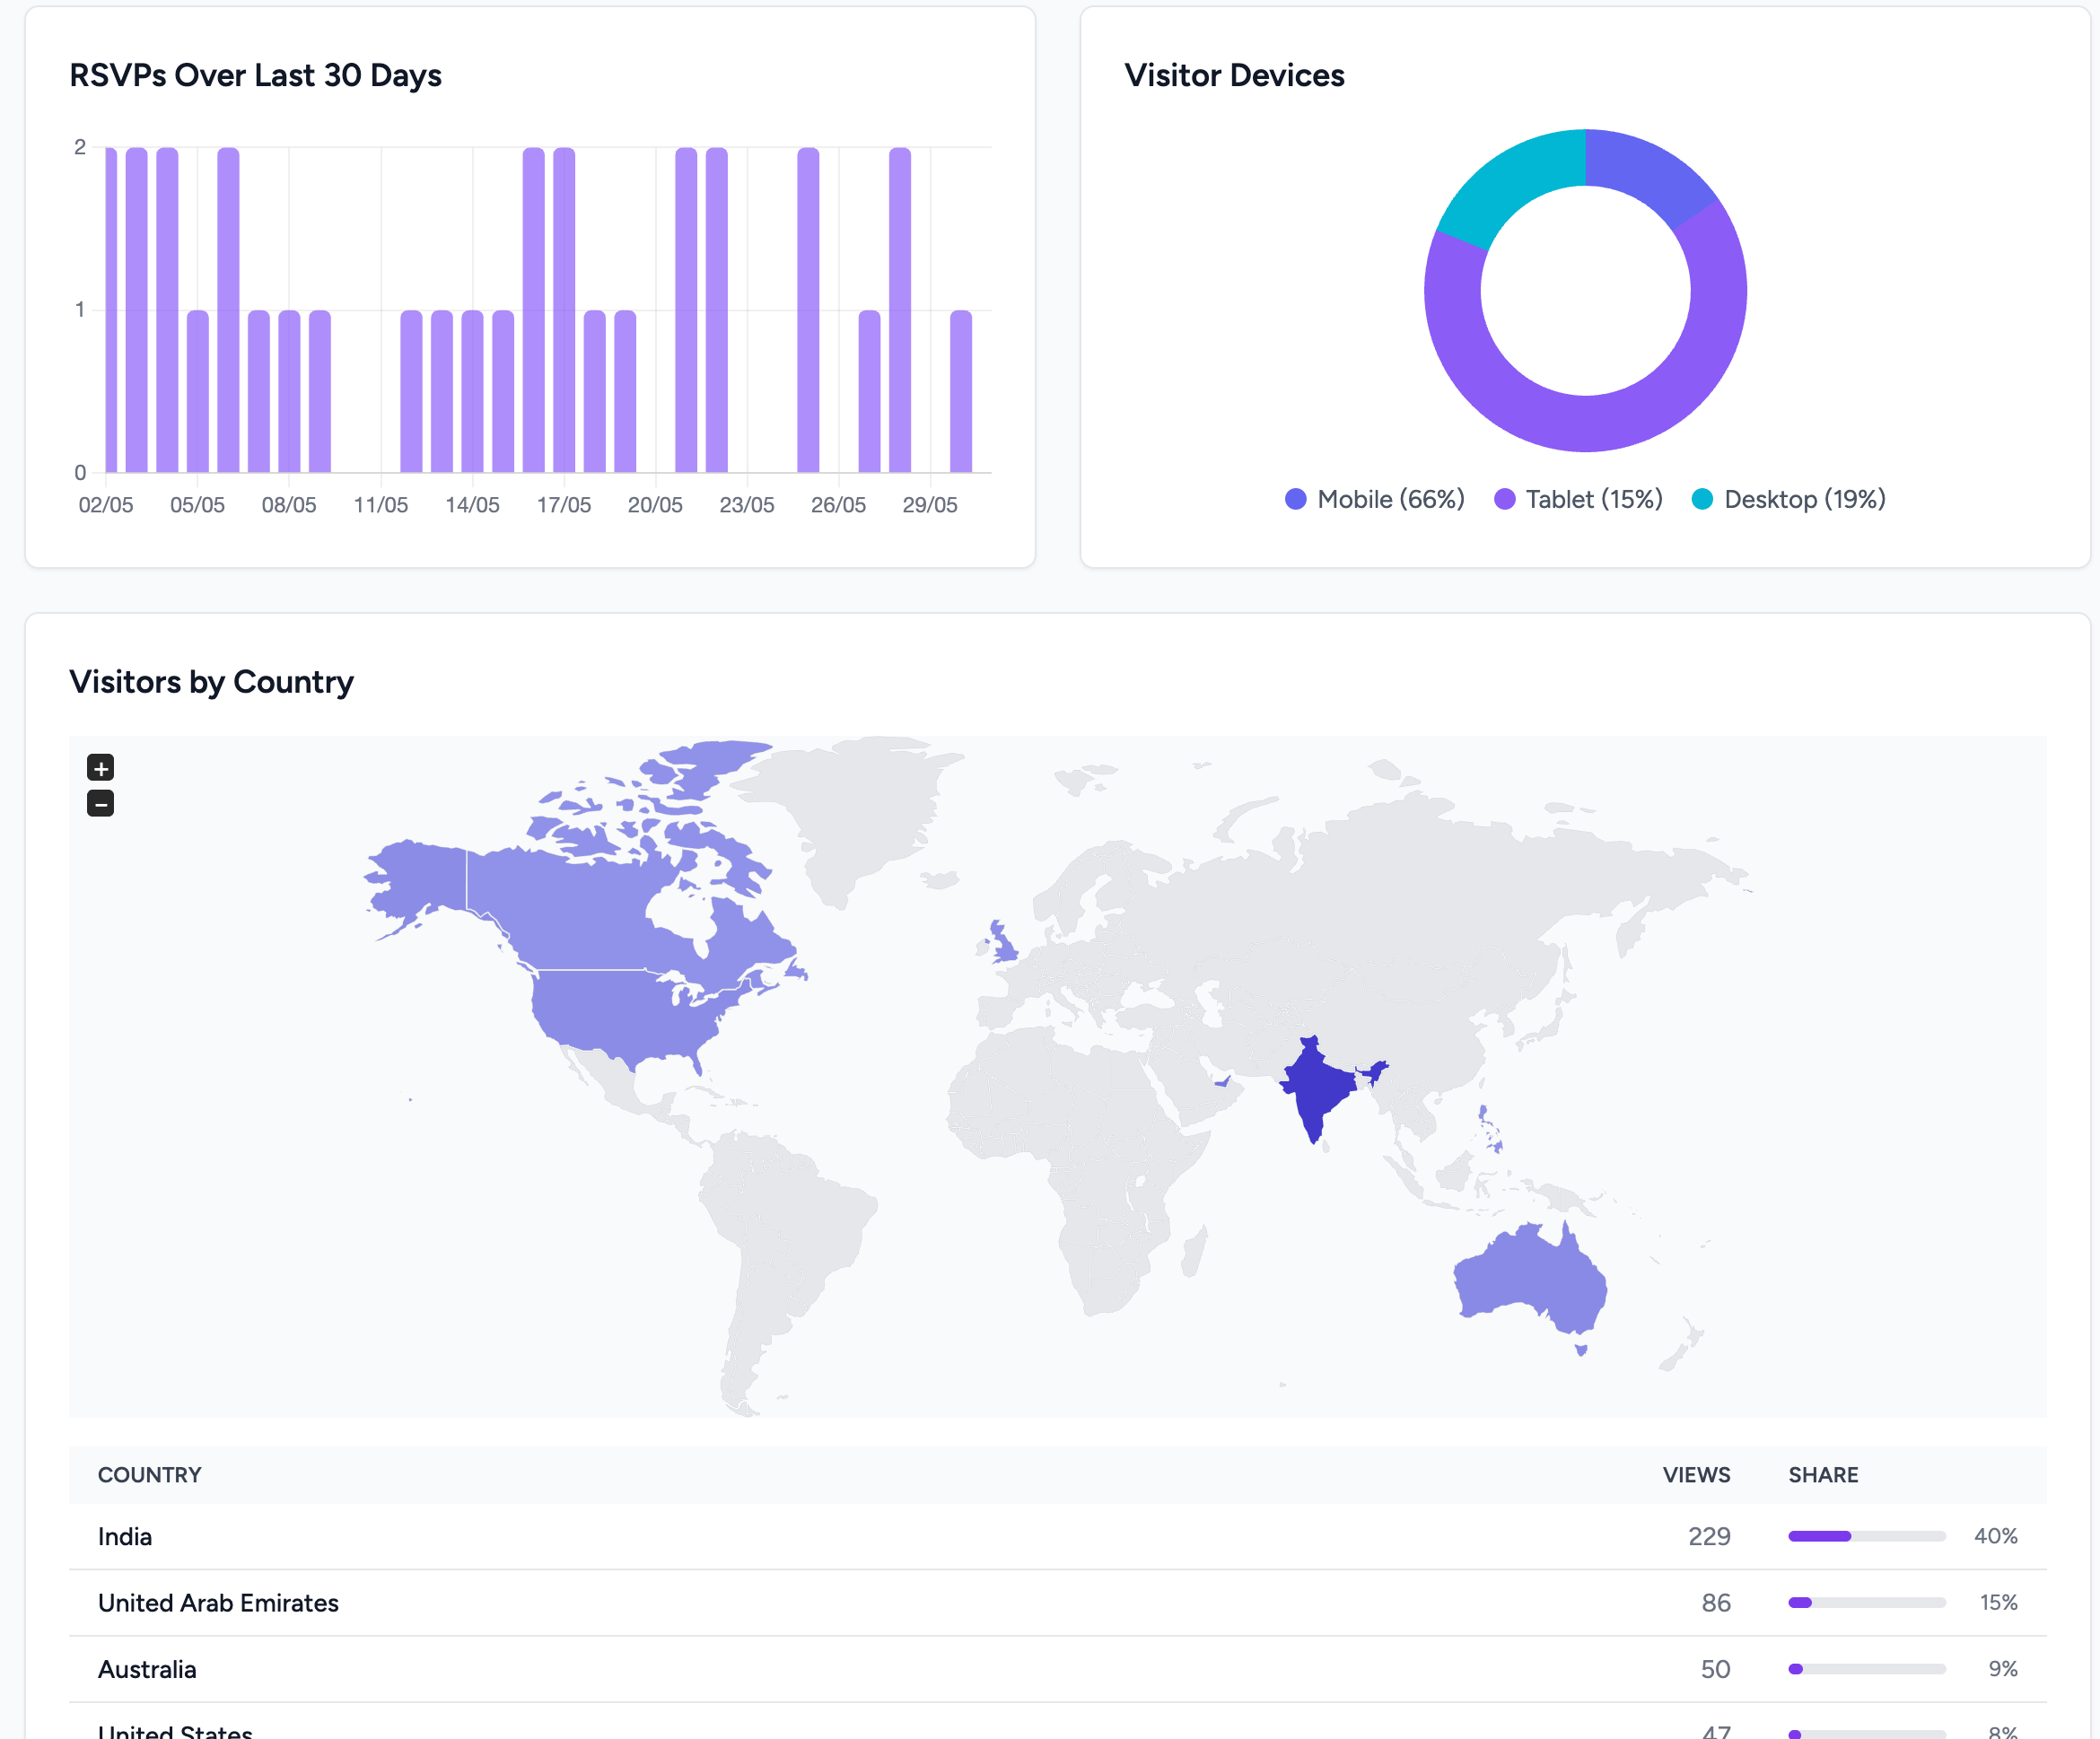
Visitor Devices
Breakdown of Mobile, Tablet, and Desktop visitors. Most Indian wedding invitation traffic is mobile — this confirms it.
Visitors by Country
A world map and a top-10 country table. Useful for destination weddings or NRI families spread across multiple countries.
Not seeing the full analytics?
Detailed charts and unique visitor data require a Premium subscription.
How to upgrade to Premium →